Executive Summary
Many modern Quality Assurance and Six Sigma practices date back to the Industrial Revolution. Techniques and tactics combining visuals and acronyms have spanned every decade since then with a common objective: how to eliminate defects by understanding what causes them.
What is possible if we use the same tools to determine the contributing forces behind our successes and how to replicate them?
Cause and Effect: The Fishbone Diagram Revisitedc
Originated in 1943 by Tokyo University professor Kaoru Ishikawa, this tool is consistently present, even today, in the quality assurance “toolbox.” A standard exercise when identifying the contributing causes of a failure, its simplicity lends itself to easy adaptation as a success analysis tool.
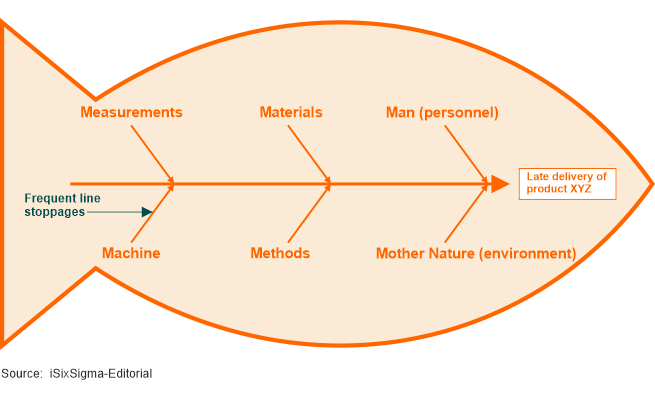
The basic design of the chart is based on the premise that contributing factors to any outcome can be grouped into higher level categories that represent the major influences on the result. In the figure above, which is from a typical manufacturing process, Man, Machine, Materials, Methods, Measurements, and Environment are considered as the most likely categories to find a source of failure in.
The categories are not listed after the known cause is identified but are present to inspire brainstorming into each of these aspects to seek out a potential source of failure.
These same or similar categories have become universally adapted even for non-manufacturing applications.
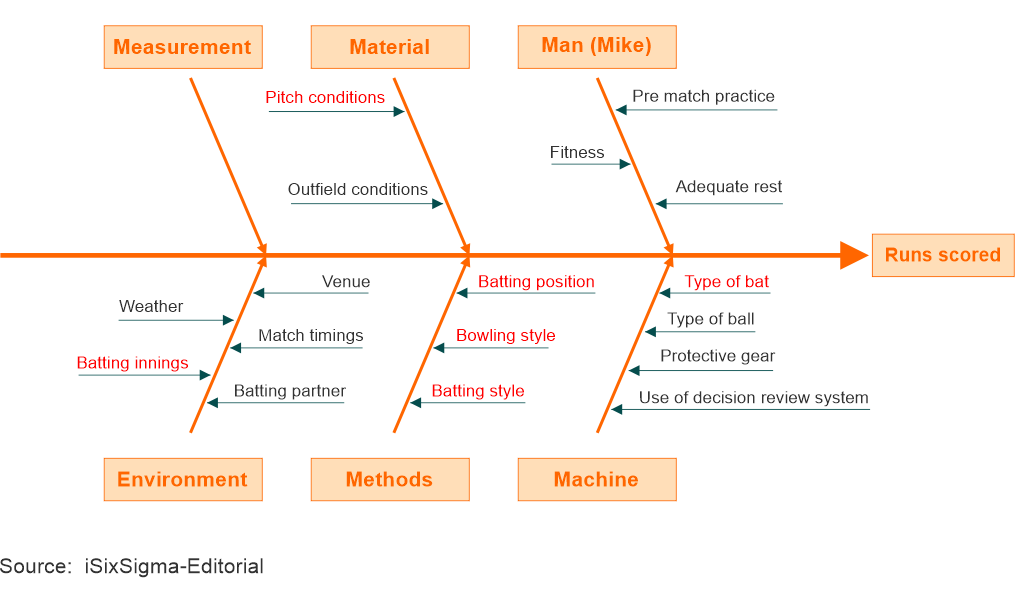
The cricket example below provides one such non-manufacturing analysis. Listed are the influencers on how many runs player Mike scores. Note that in this example, this could be both a failure analysis and a success analysis: what levers need to be thrown to maximize the number of runs scored. The items highlighted in red were those thought most influential and, therefore the ones focused on and further analyzed.
Application of the Fishbone Diagram Tool to Vee Healthtek’s Net Promoter Score (NPS) Data:
Developed by Fred Reichheld in 1993, the Net Promotor Score evolved from the observation that there is a single question most correlated with a client’s overall satisfaction: whether they would refer a company or product to someone else. The score sits on a scale of -100 to +100 and is calculated by subtracting the % of respondents who, on a scale of 0 to 10, answered 0 to 6 (a Detractor) from the % of respondents who responded 9 and 10 (a Promoter) to the question: “How likely are you to refer our company to a colleague or someone in a similar role?”
Evaluating the “whys” shared by clients in the promoter category, we find these six factors stated again and again: Sense of Urgency, Teamwork/Team Players, Adaptable/Accommodating to changes from client, Ease of Communication/Responsiveness, Quality/Accuracy, Accountability.

Each client team now has a tool to brainstorm what practices, processes, and behaviors will define the above six objectives for its specific client. If a client responded with a promoter value of less than 10, these are the places to look first for where to move the mark.
One client who responded with an 8 score, listed urgency, quality, and team players as pluses, but did not note on the other three aspects. This gives us the first places to look to create more success with this client. Evaluating the promoters who emphasized the three attributes not experienced by this client gives even more insight into what success in those areas looks like.
Let’s look at adaptability, one of the strengths that did not come to mind for client “8.” When evaluating all clients who noted adaptability as one of our strengths, we can see that team players and communication are also high-ranked and may be potentially correlated. And now, we may also see which team members are common to both client “8” and clients who note our success in adaptability. Internal conversations between these teams are the next step. A deeper dive, guided by the fishbone chart analysis exercise, on what business and operational structures are used at the “adaptable” clients that are not in play for this client will begin to surface multiple avenues to actualize adaptability for this client and others.
Summary
Flipping the focus of traditional failure analysis tools to accomplish success analysis alters our conversations to what do we need to do more of, rather than what do we need to prevent. When we identify the successful practices, processes, and behaviors that are at the source of the most client satisfaction, we have the essential knowledge to perpetuate optimal outcomes for all our clients.
That’s a win-win, any way we look at it.